Plant Variety Protection Data and Statistics
Animated graphics
examples
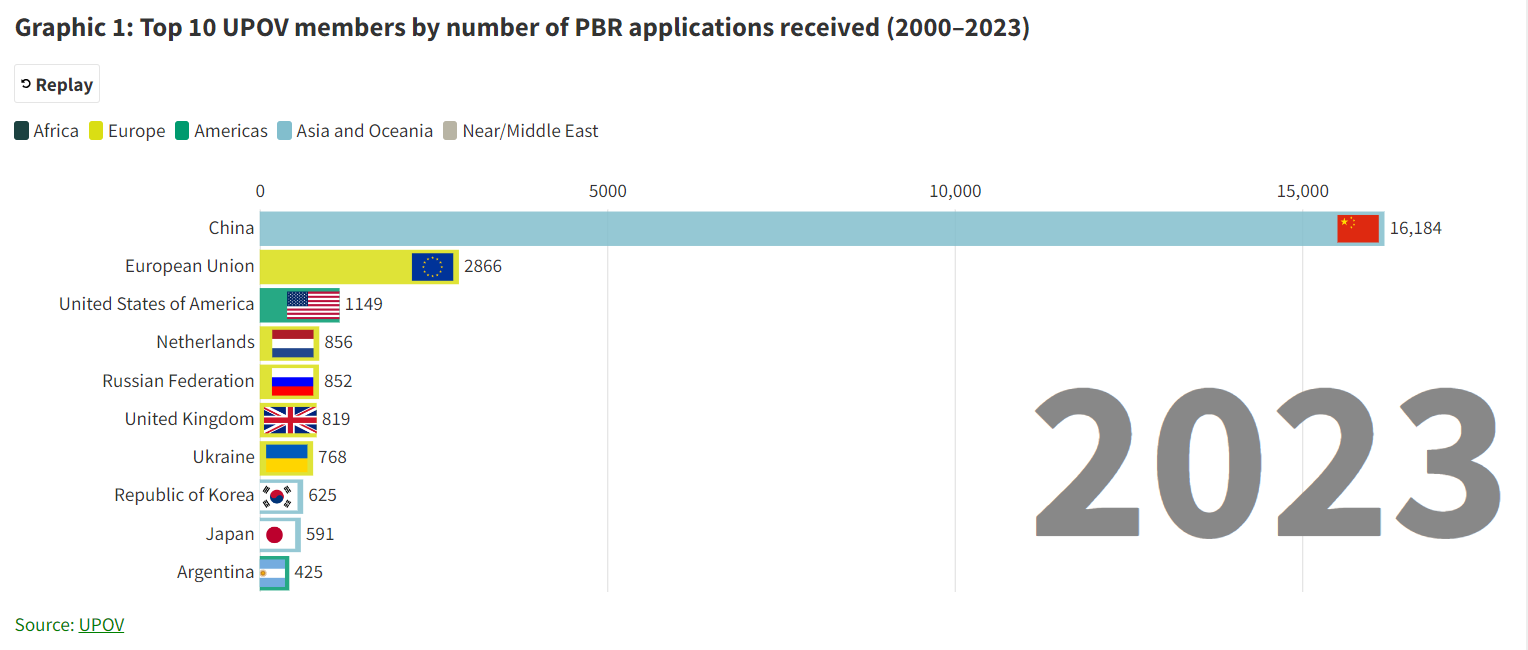
- Graphic 1: Top 10 UPOV members by number of PBR applications received (2000-2023)
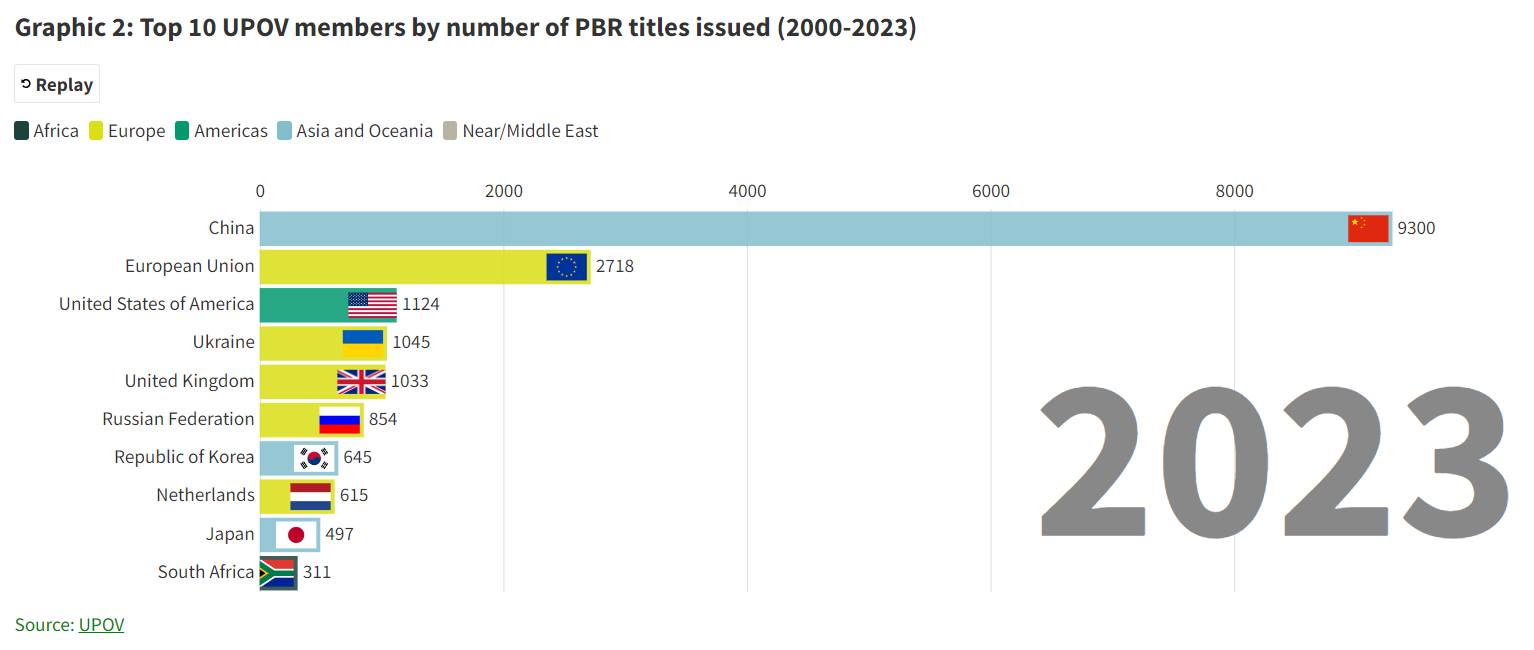
- Graphic 2: Top 10 UPOV members by number of PBR titles issued (2000-2023)
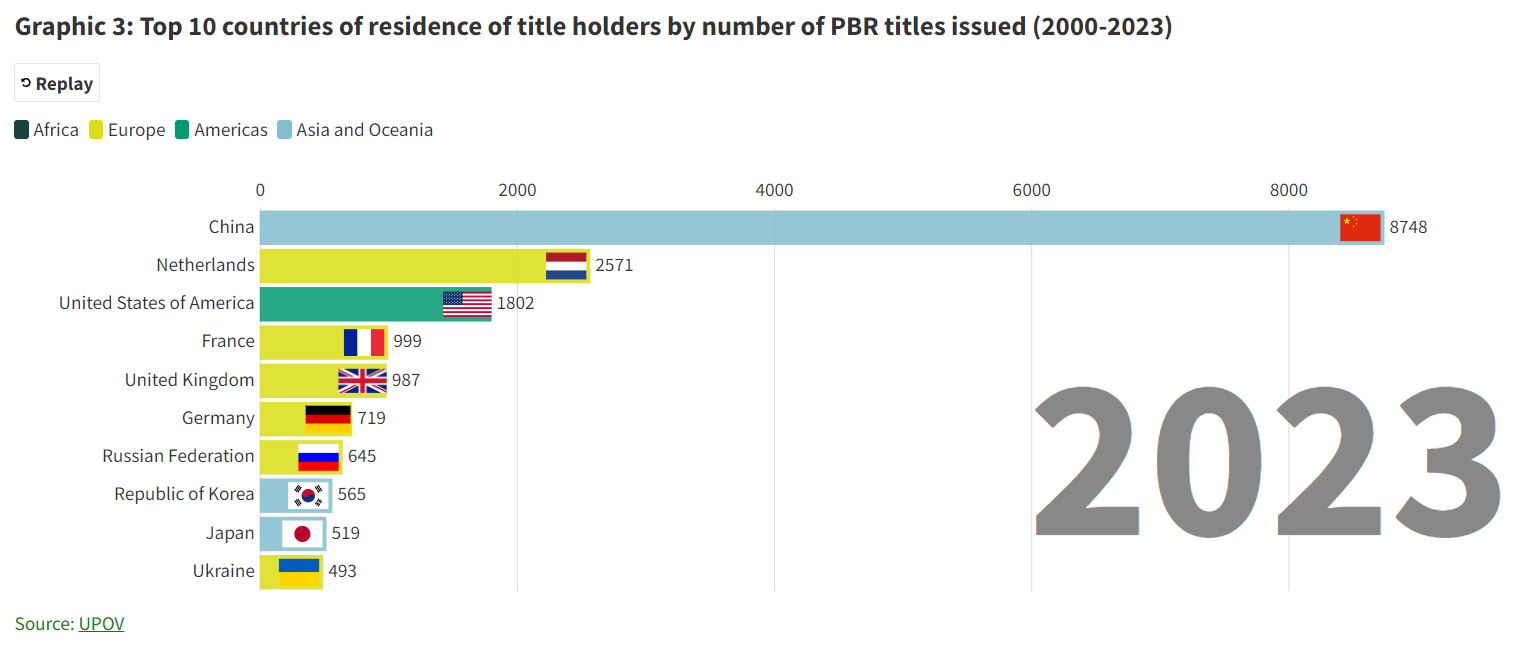
- Graphic 3: Top 10 countries of residence of title holders by number of PBR titles issued (2000-2023)
Charts and graphs
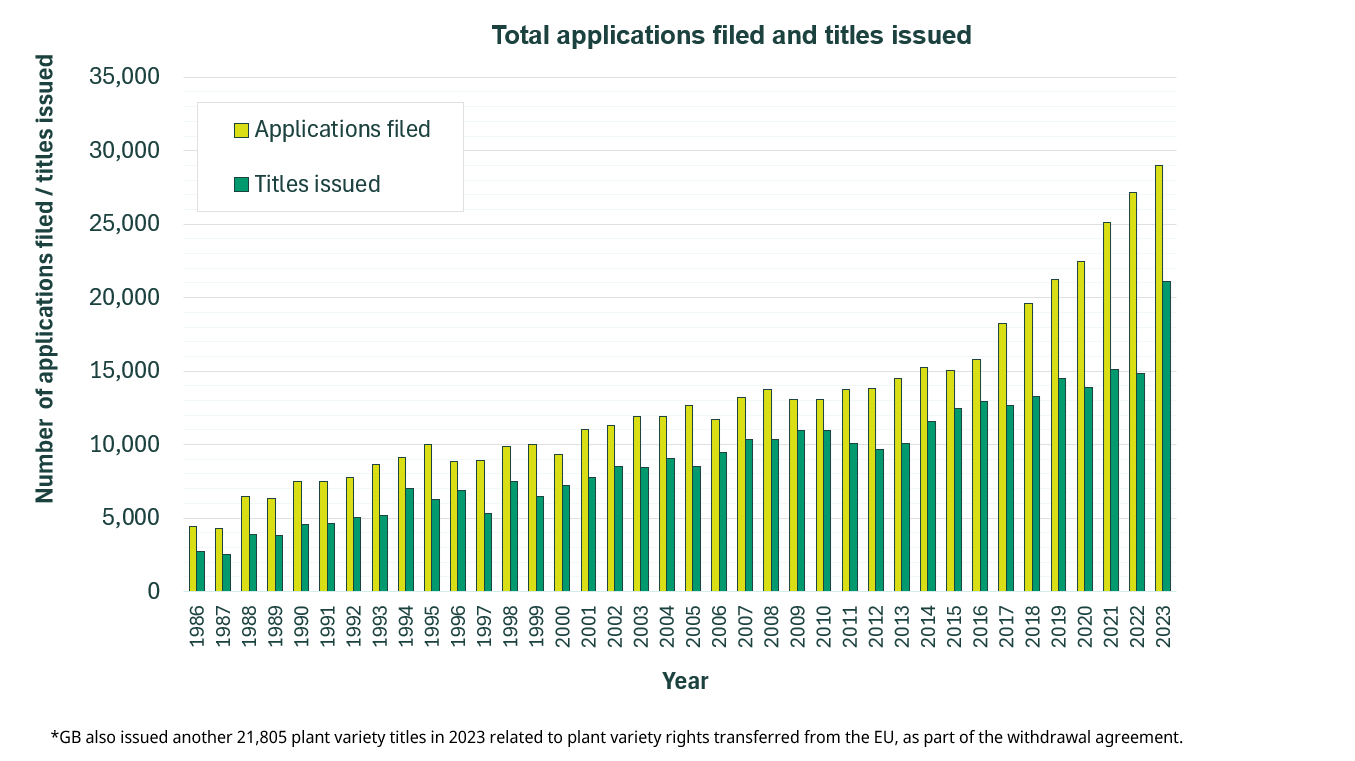
- Applications filed and titles issued (total = residents and non-residents)
- Applications filed by residents/non-residents
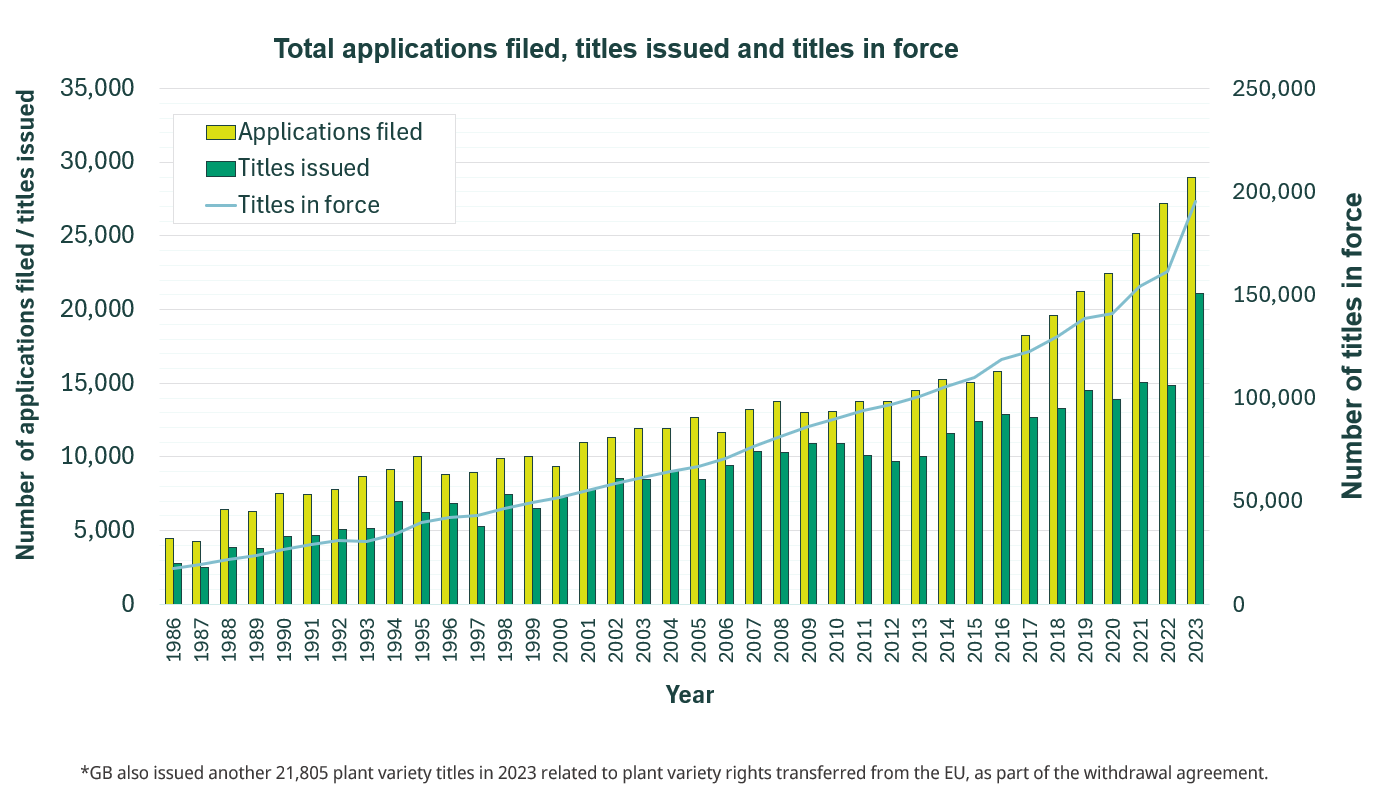
- Applications filed, titles issued and titles in force (total = residents and non-residents)
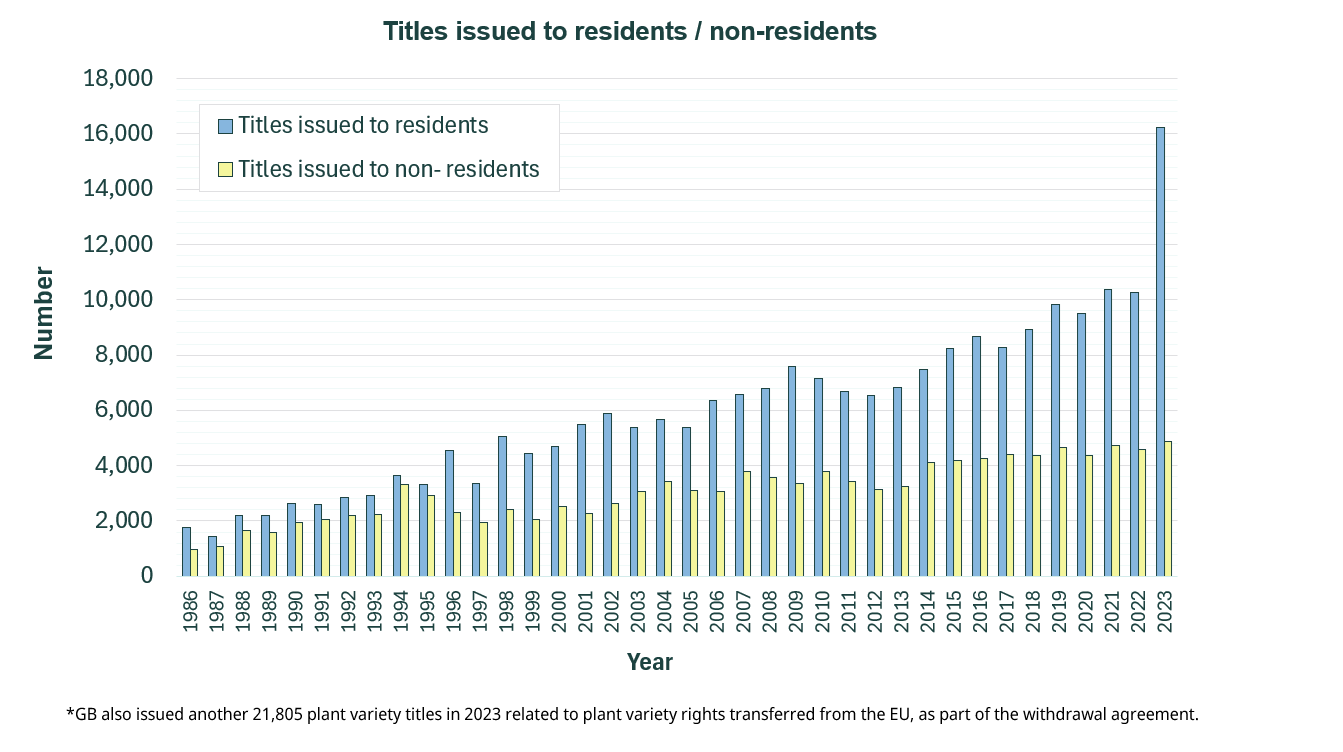
- Titles issued: residents/non-residents
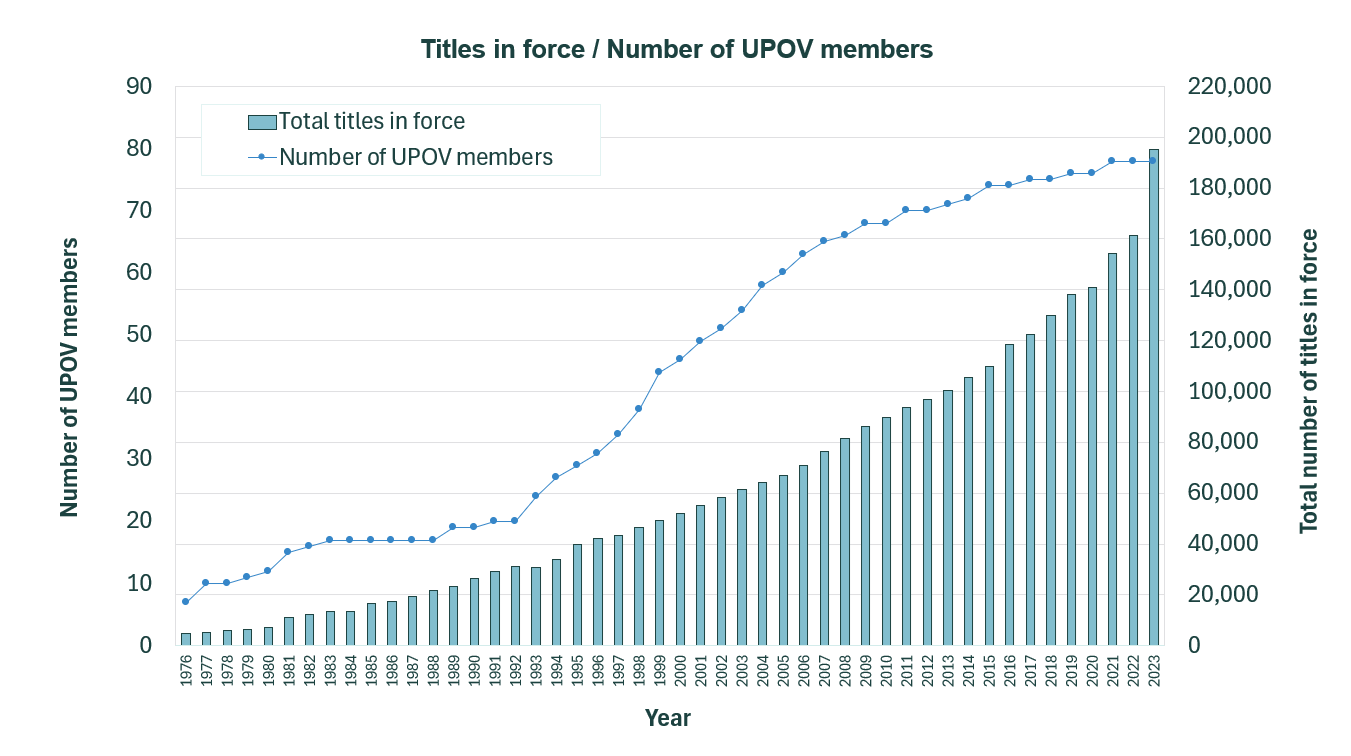
- Titles in force / Number of UPOV members
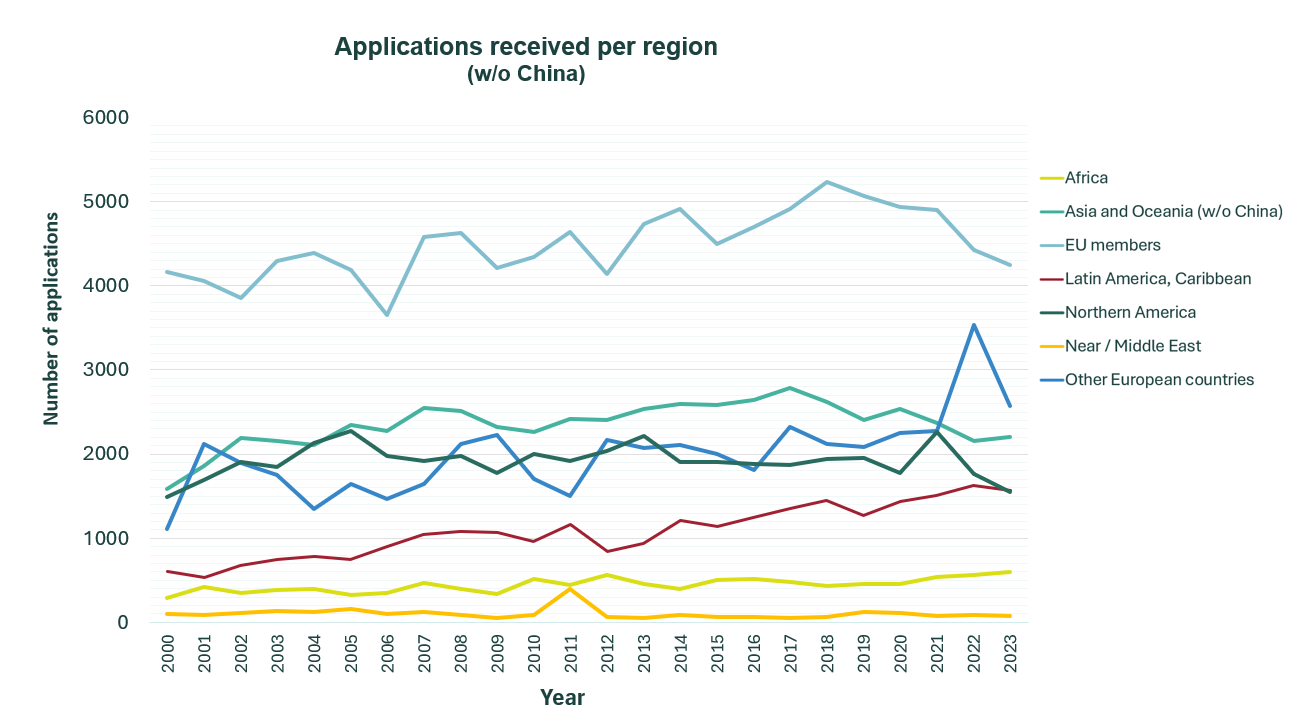
- Applications received per region (without China)
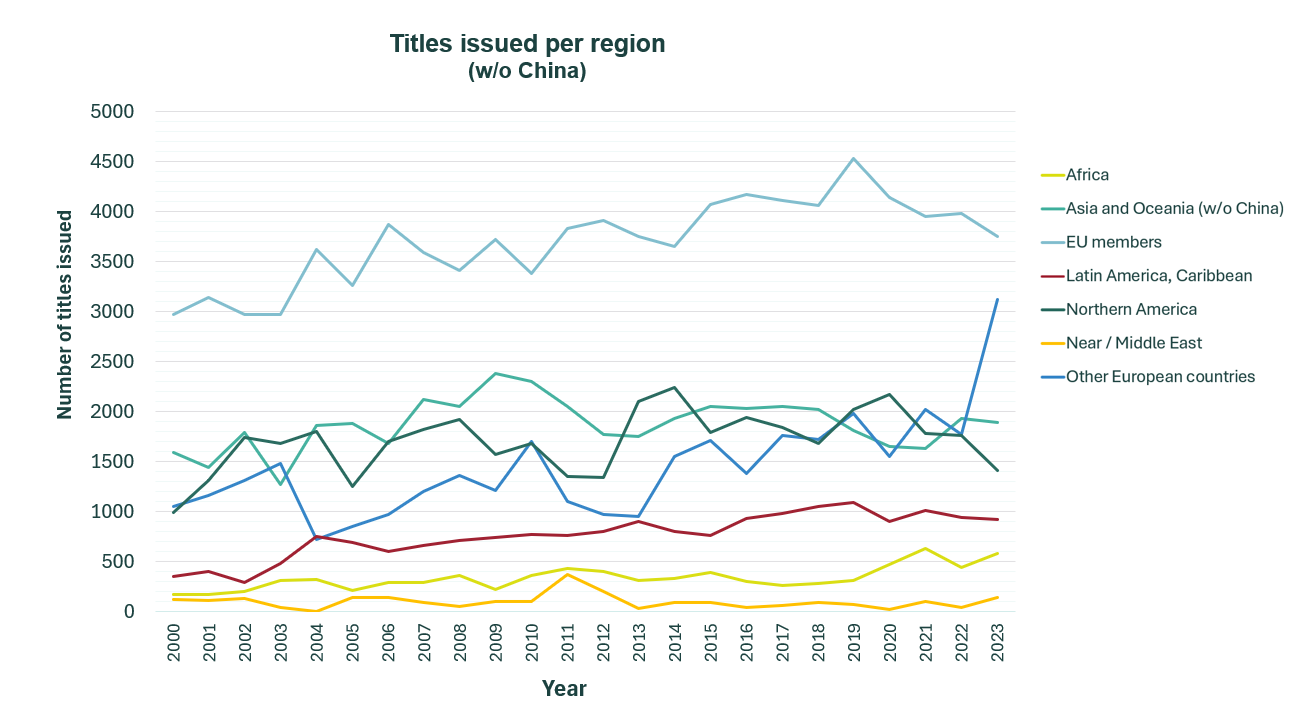
- Titles issued per region (without China)
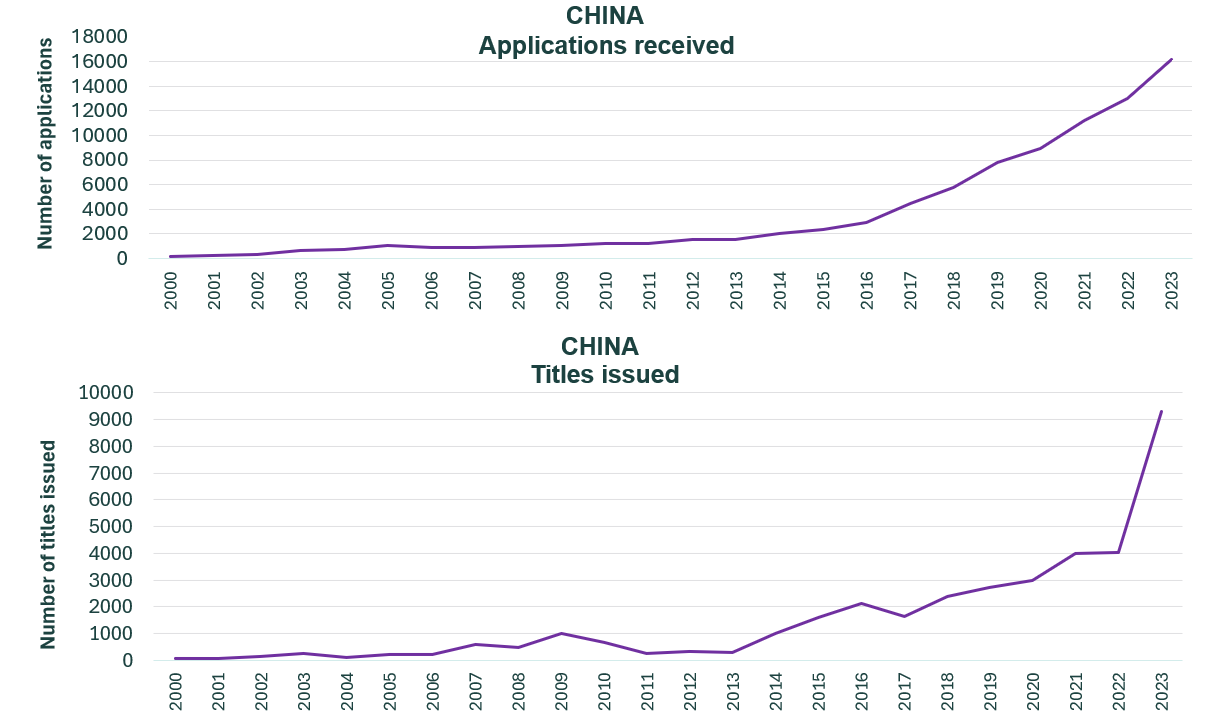
- Applications received / Titles issued (China)
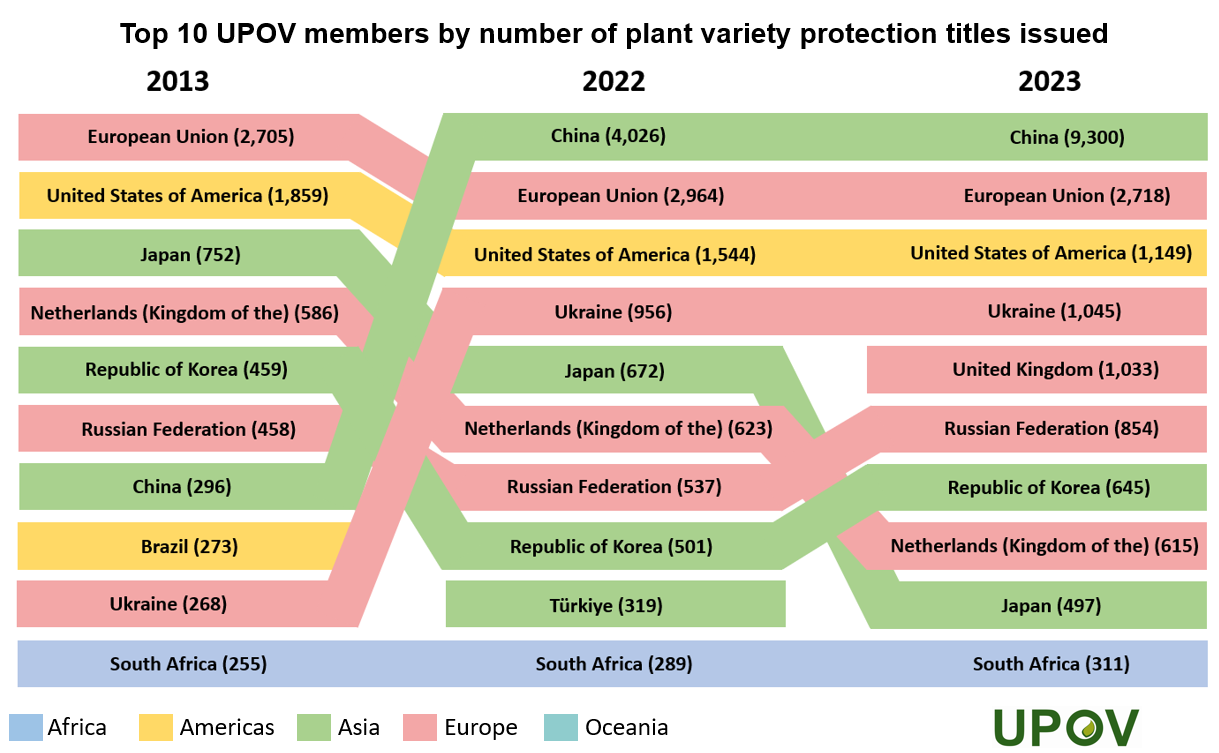
- Top 10: UPOV members by number of titles issued
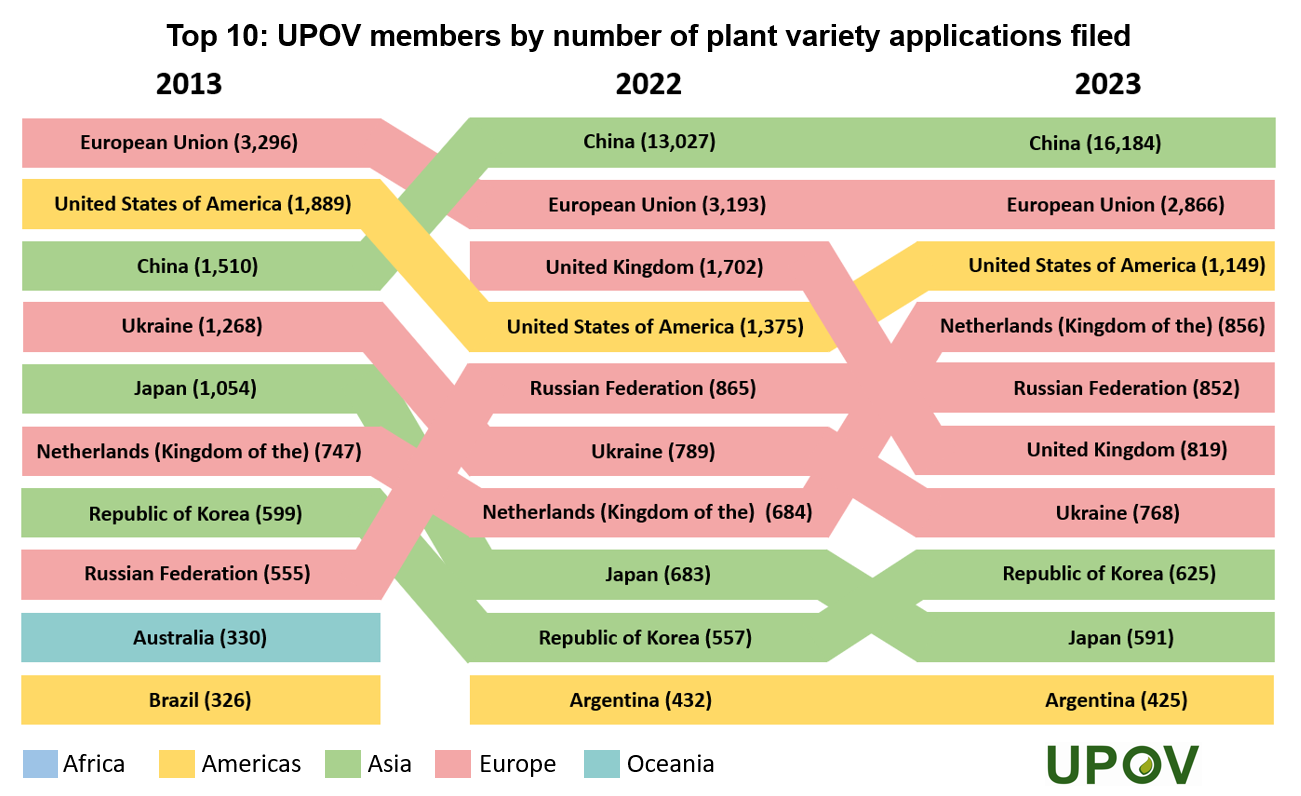
- Top 10: UPOV members by number of applications filed
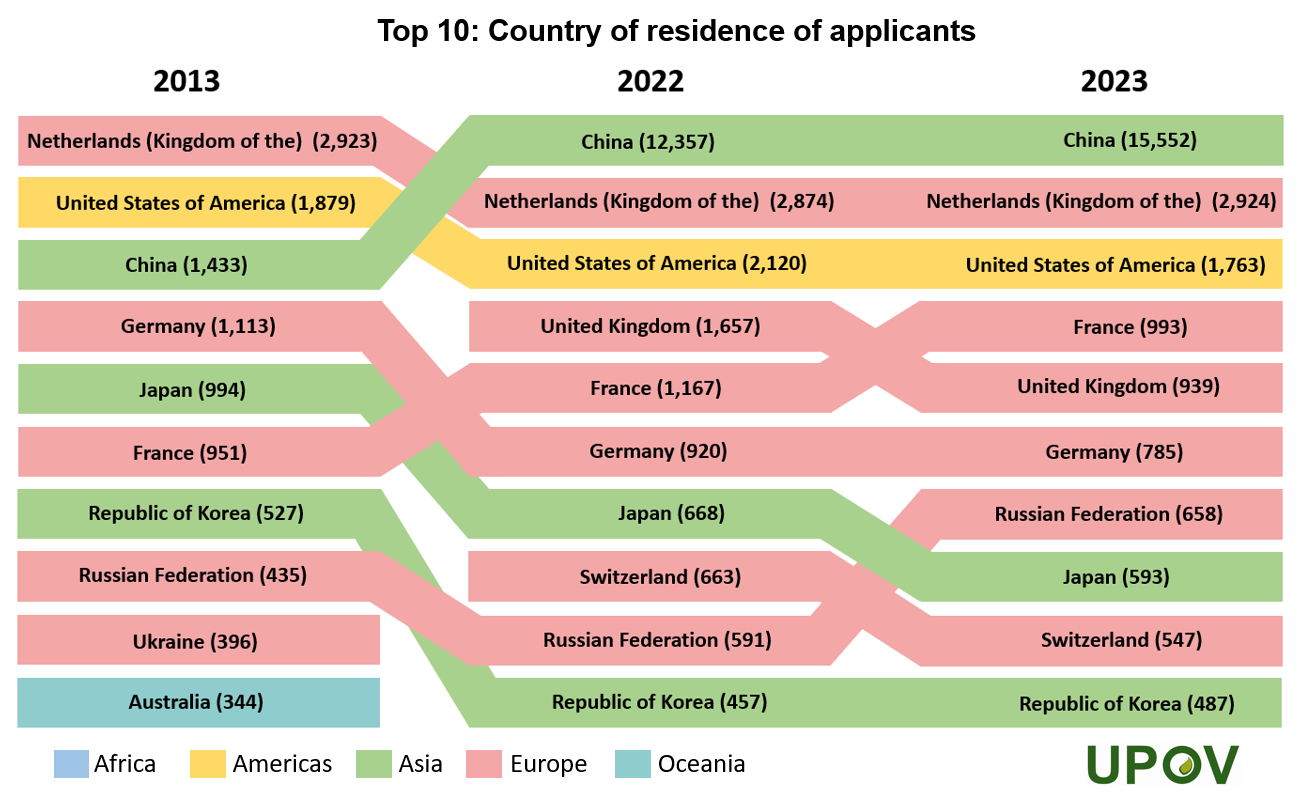
- Top 10: Country of residence of applicants
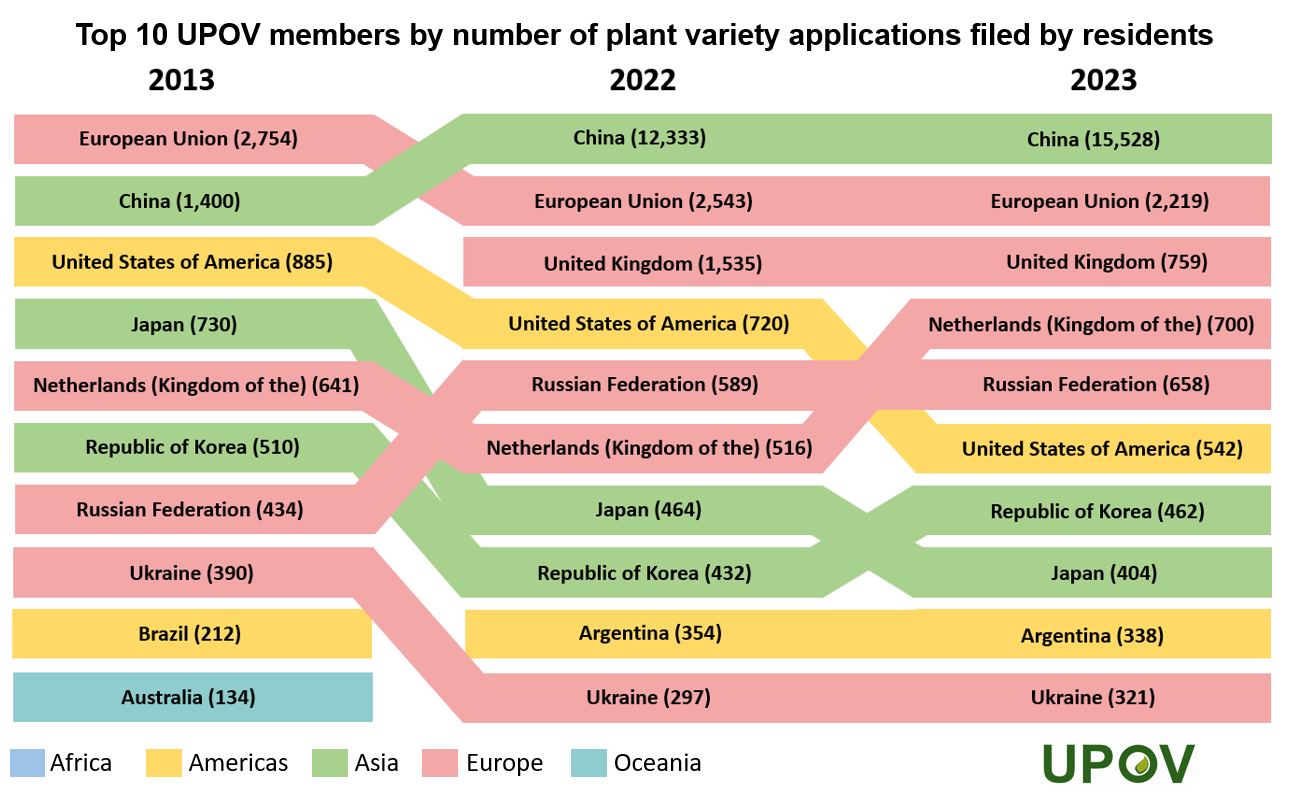
- Top 10: Applications filed by residents
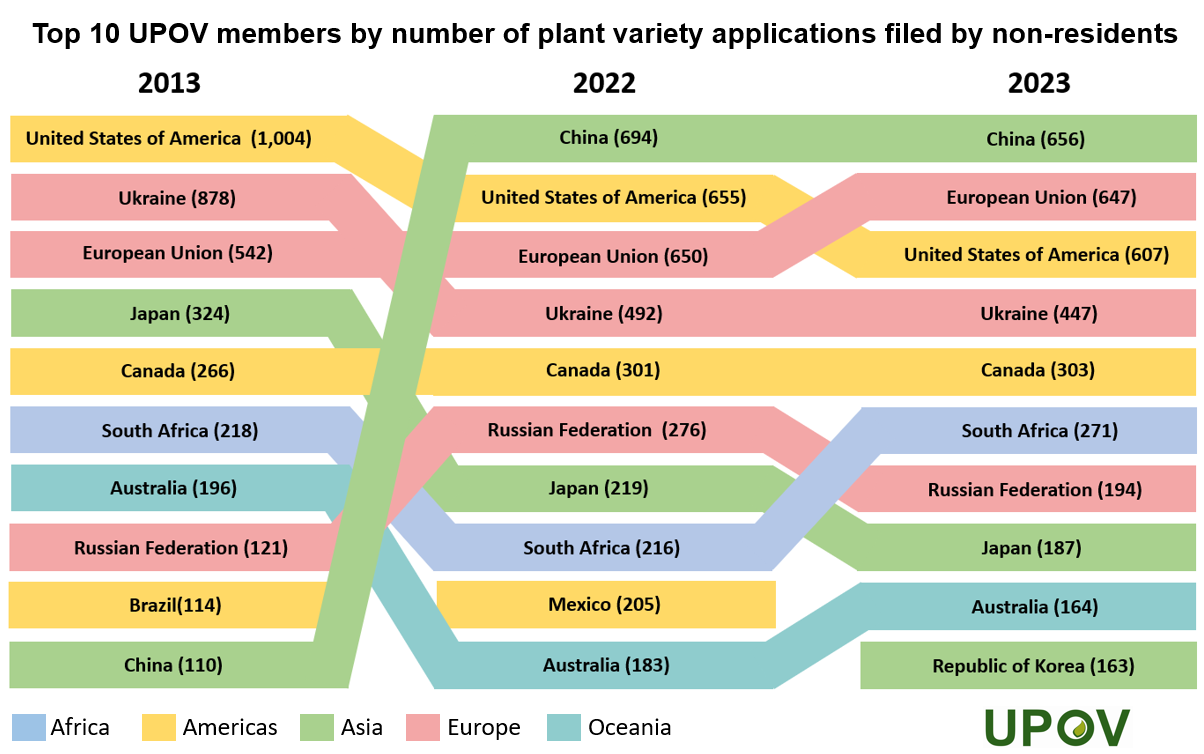
- Top 10: Applications filed by non-residents
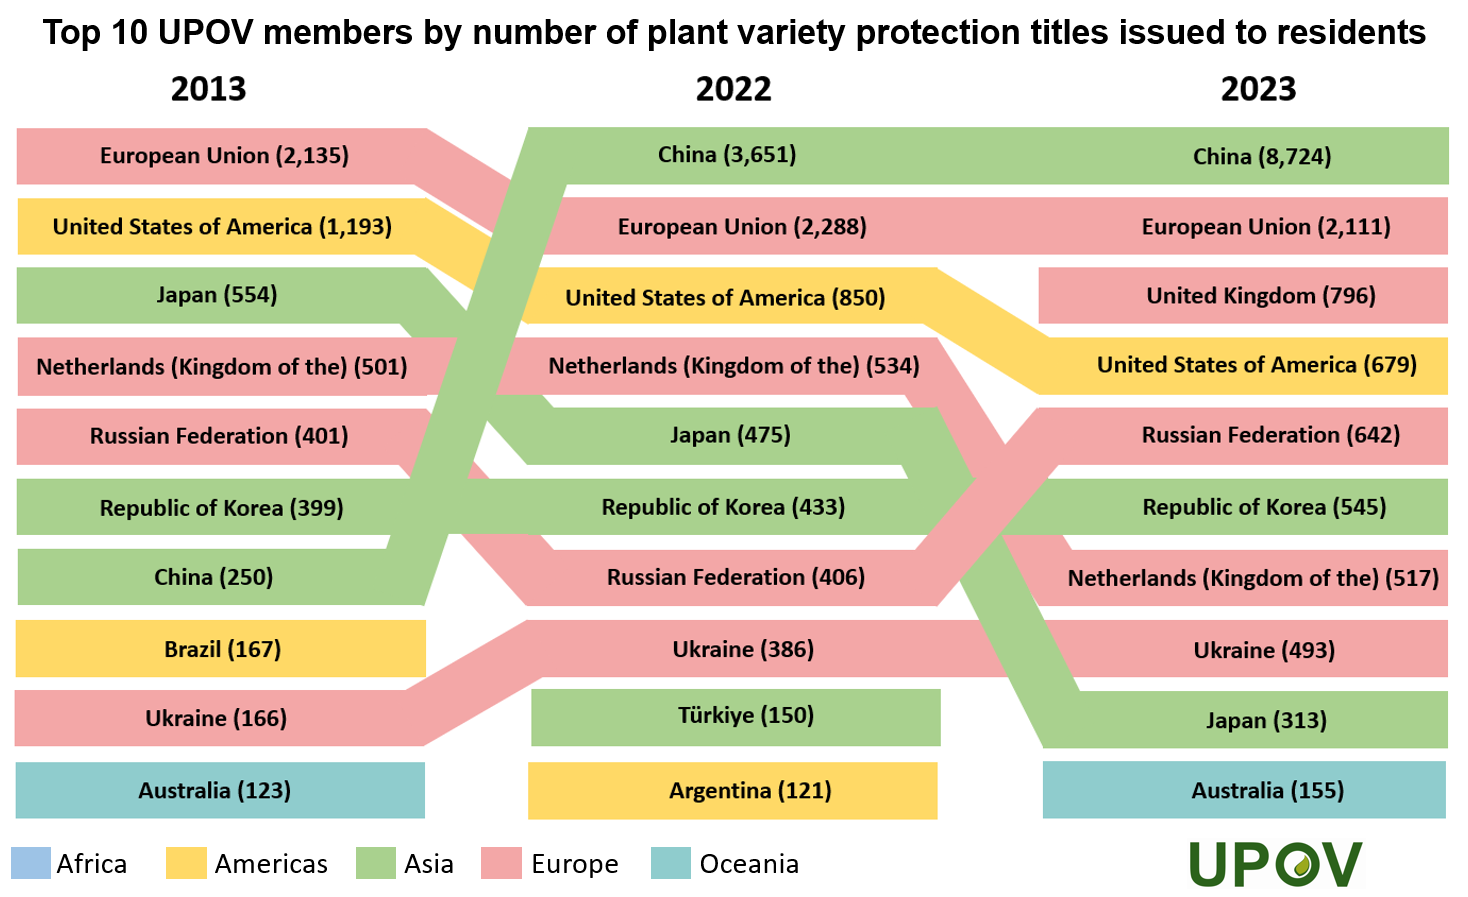
- Top 10: Titles issued to residents
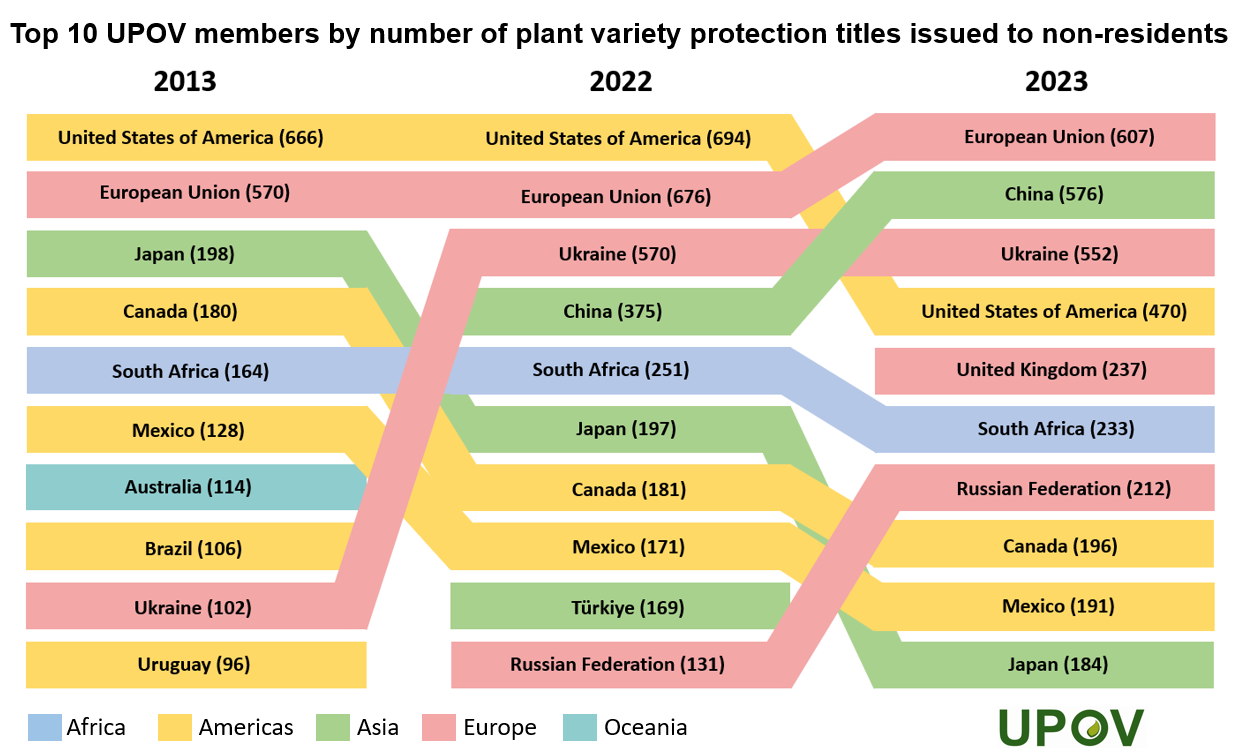
- Top 10: Titles issued to non-residents
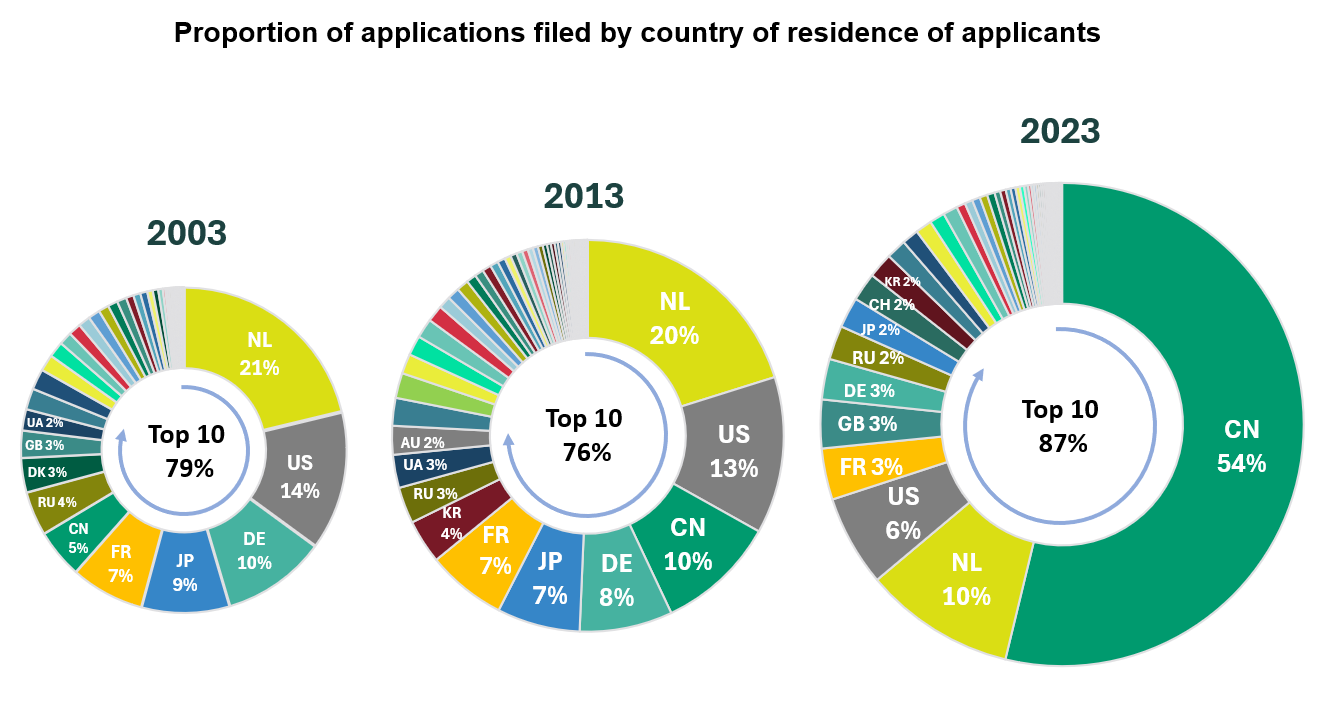
- Proportion of applications filed by country of residence of applicants
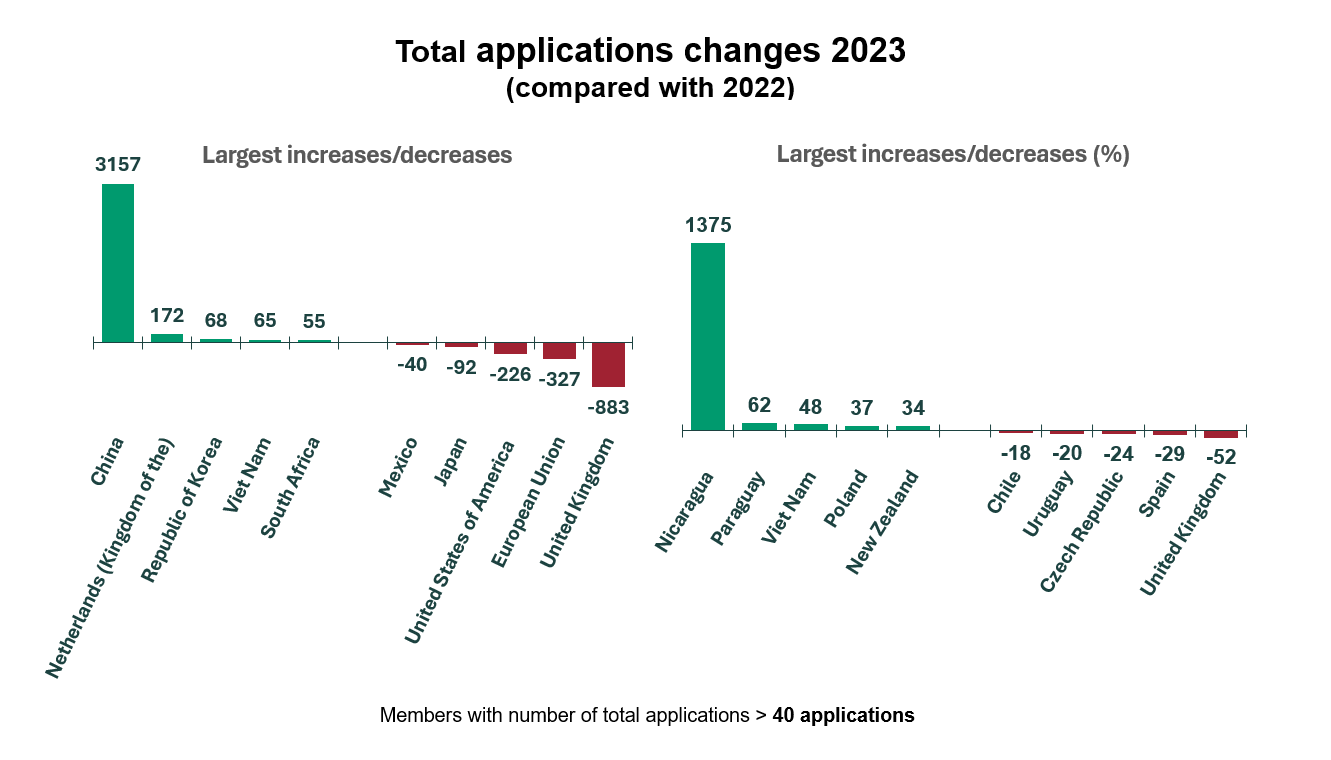
- Largest increases/decreases in numbers of applications in 2023 (compared with 2022)
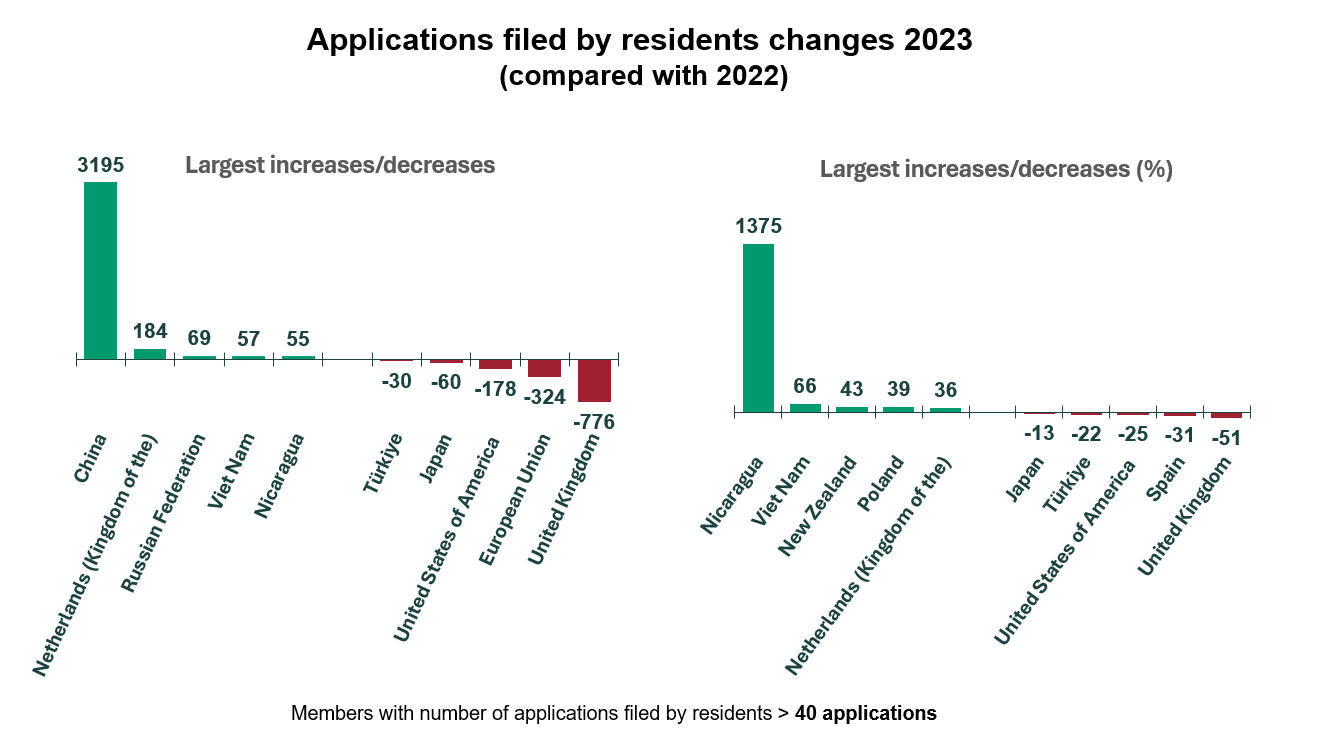
- Largest increases/decreases in numbers of applications filed by residents in 2023 (compared with 2022)
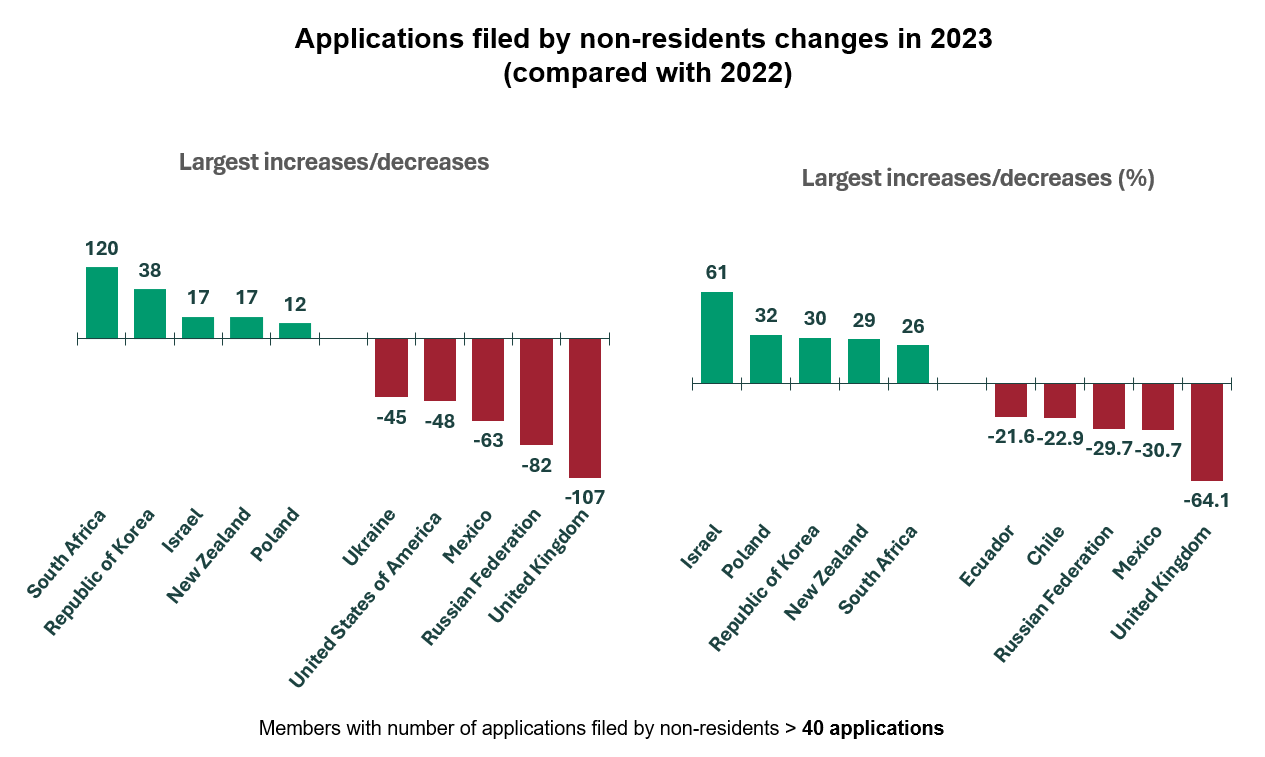
- Largest increases/decreases in numbers of applications filed by non-residents in 2023 (compared with 2022)
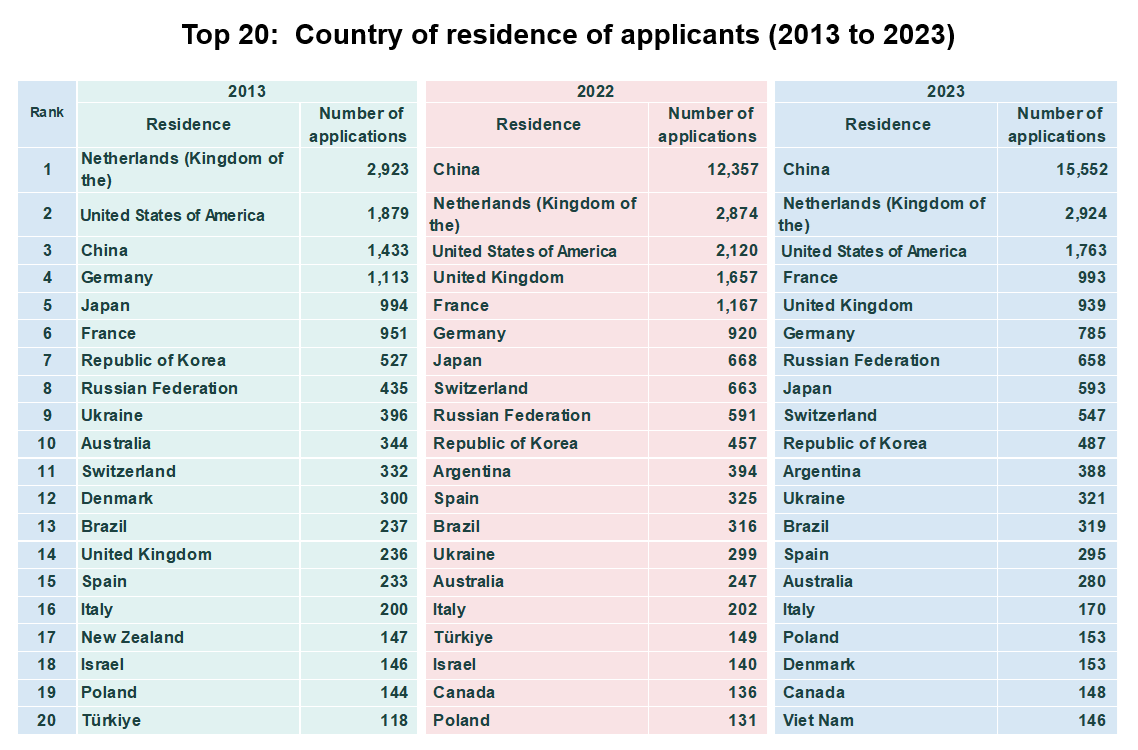
- Top 20: Country of residence of applicants (2013 - 2022 - 2023)
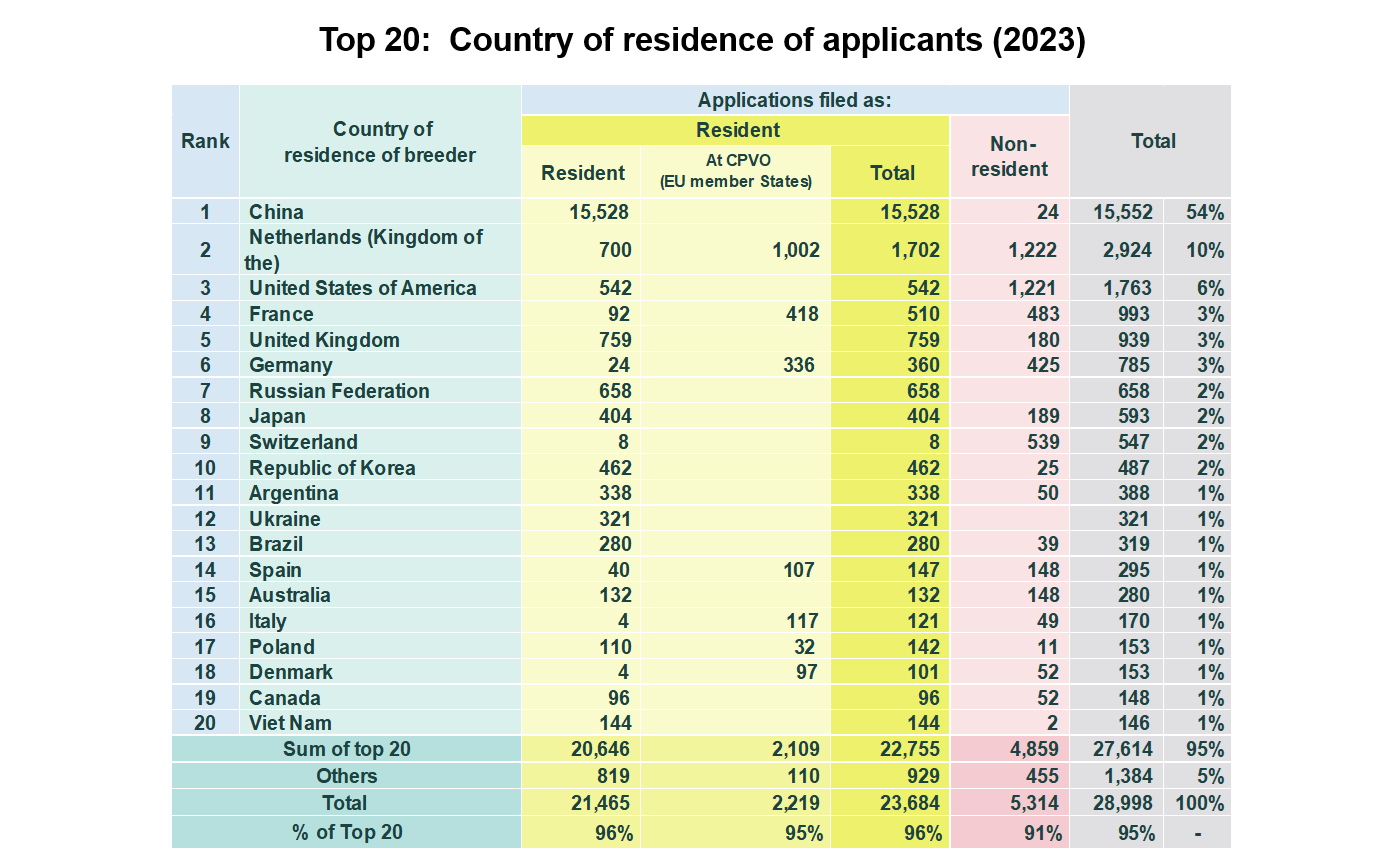
- Top 20: Country of residence of applicants (2023)
Animated graphics
Graphic 1: Top 10 UPOV members by number of PBR applications received (2000-2023)
Graphic 2: Top 10 UPOV members by number of PBR titles issued (2000-2023)
Graphic 3: Top 10 countries of residence of title holders by number of PBR titles issued (2000-2023)
Charts and graphs
Applications filed and titles issued (total = residents and non-residents)
Applications filed by residents/non-residents
Applications filed, titles issued and titles in force (total = residents and non-residents)
