UPOV provides a range of statistics related to plant variety protection (PVP) based on data submitted by its members. These include annual reports and trends on number of applications and titles issued.
The statistical data is published as part of the UPOV report “Plant Variety Protection Statistics and Annual Report of the Council” and are freely accessible.
To consult previous five-year periods, see document C/[session]/[INF]/7 of the relevant ordinary session of the Council.
PVP statistics for the latest period are provided below
Top 10 UPOV members by number of PBR applications received (2014-2024)
Top 10 UPOV members by number of PBR titles issued (2014-2024)
Top 10 countries of residence of title holders by number of PBR titles issued (2014-2024)
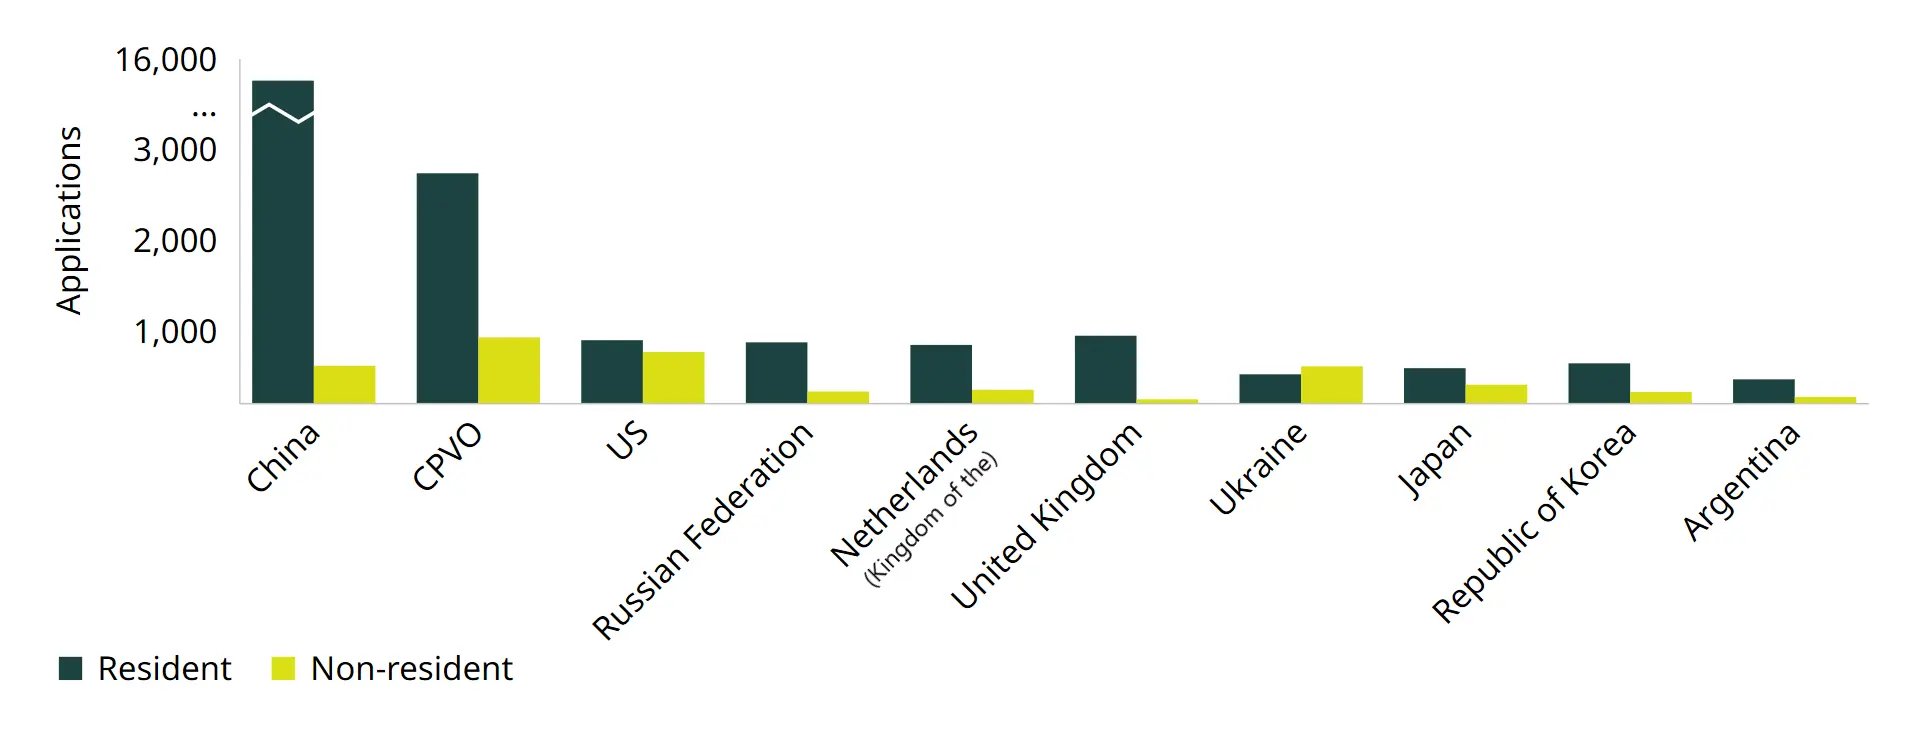
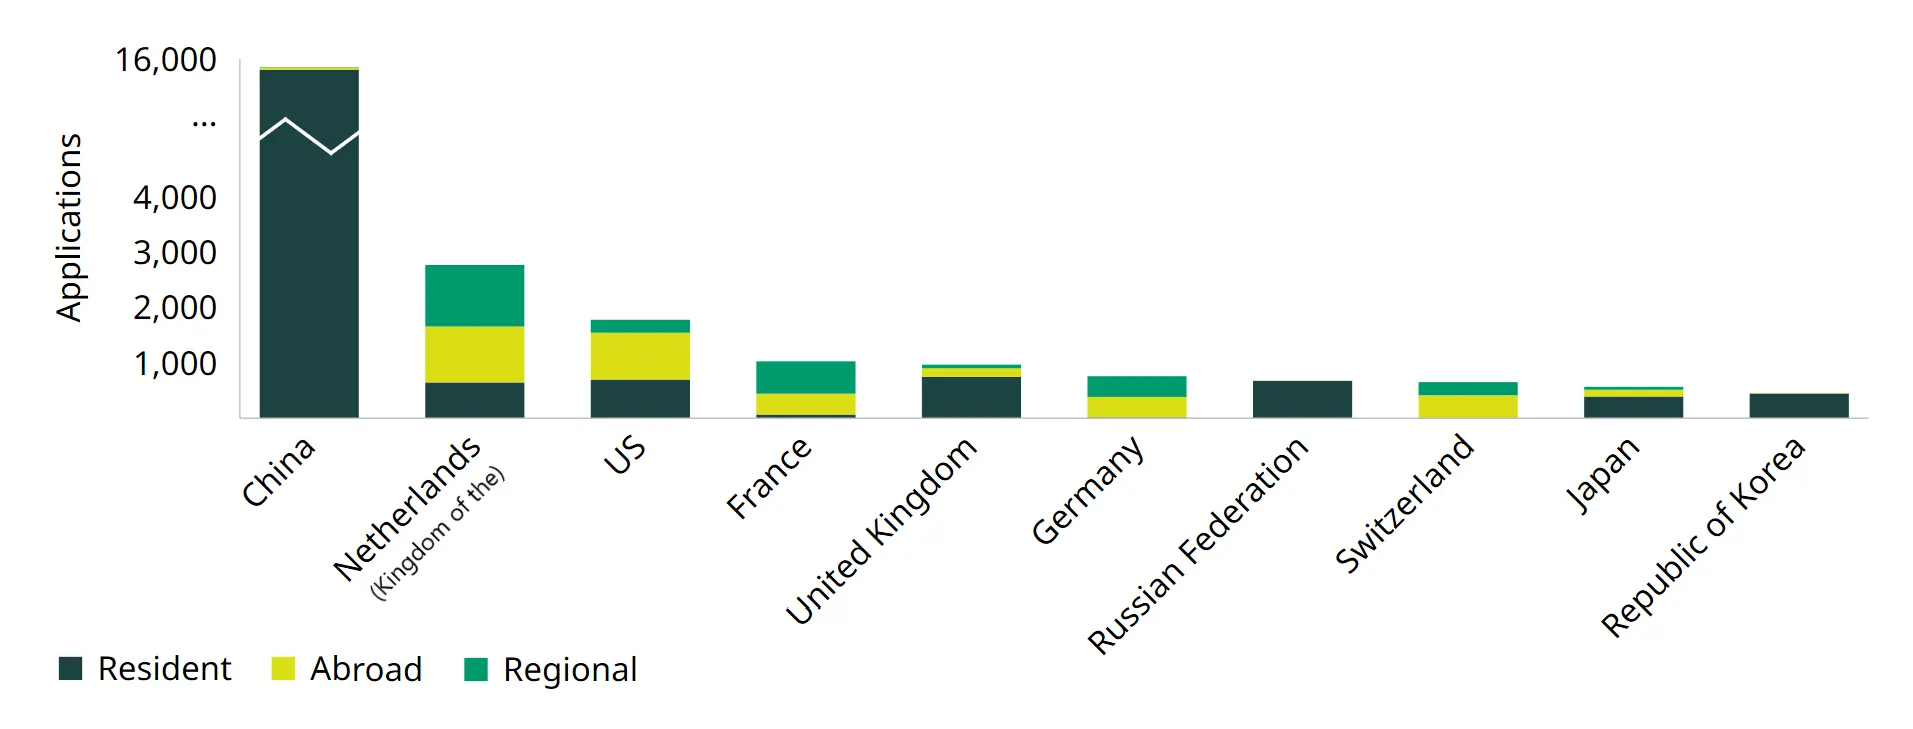
Plant variety applications for the top 10 offices, 2024
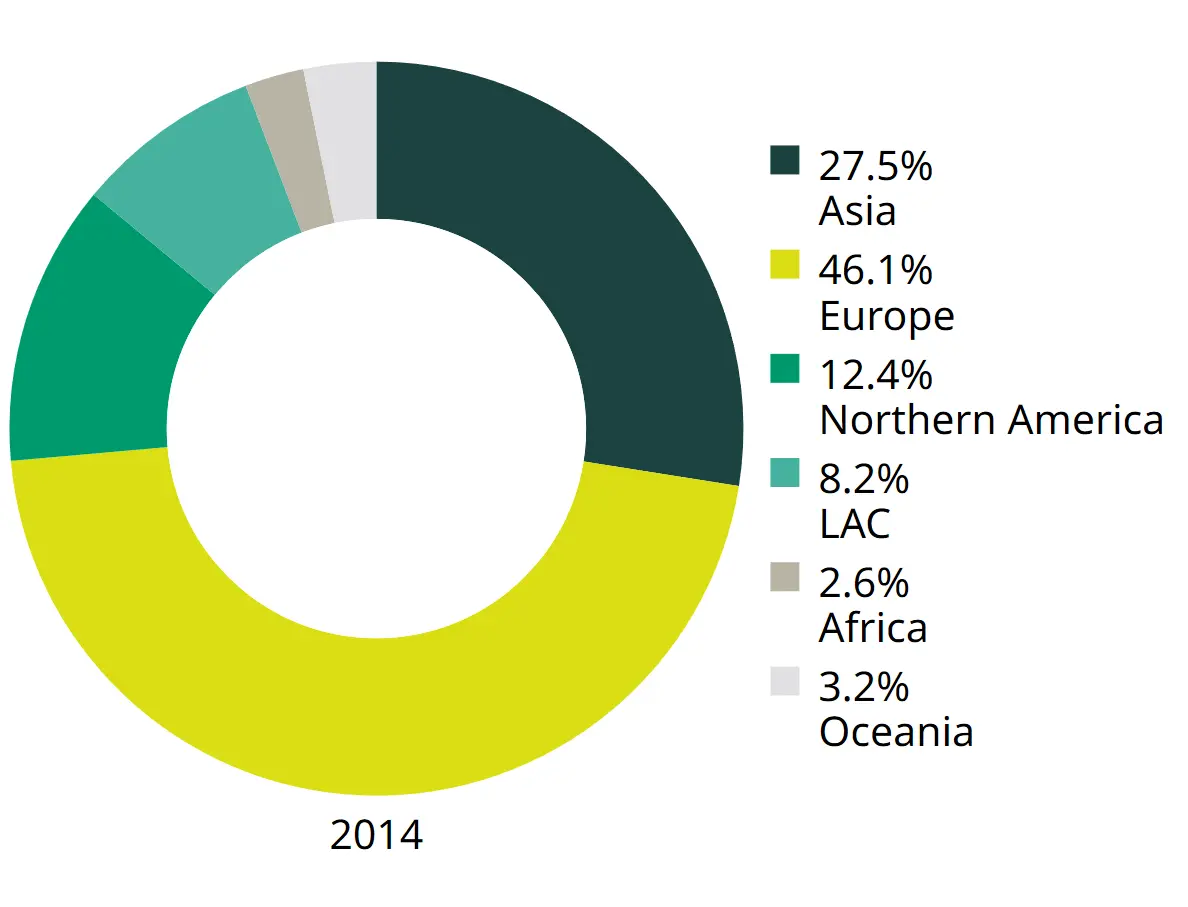
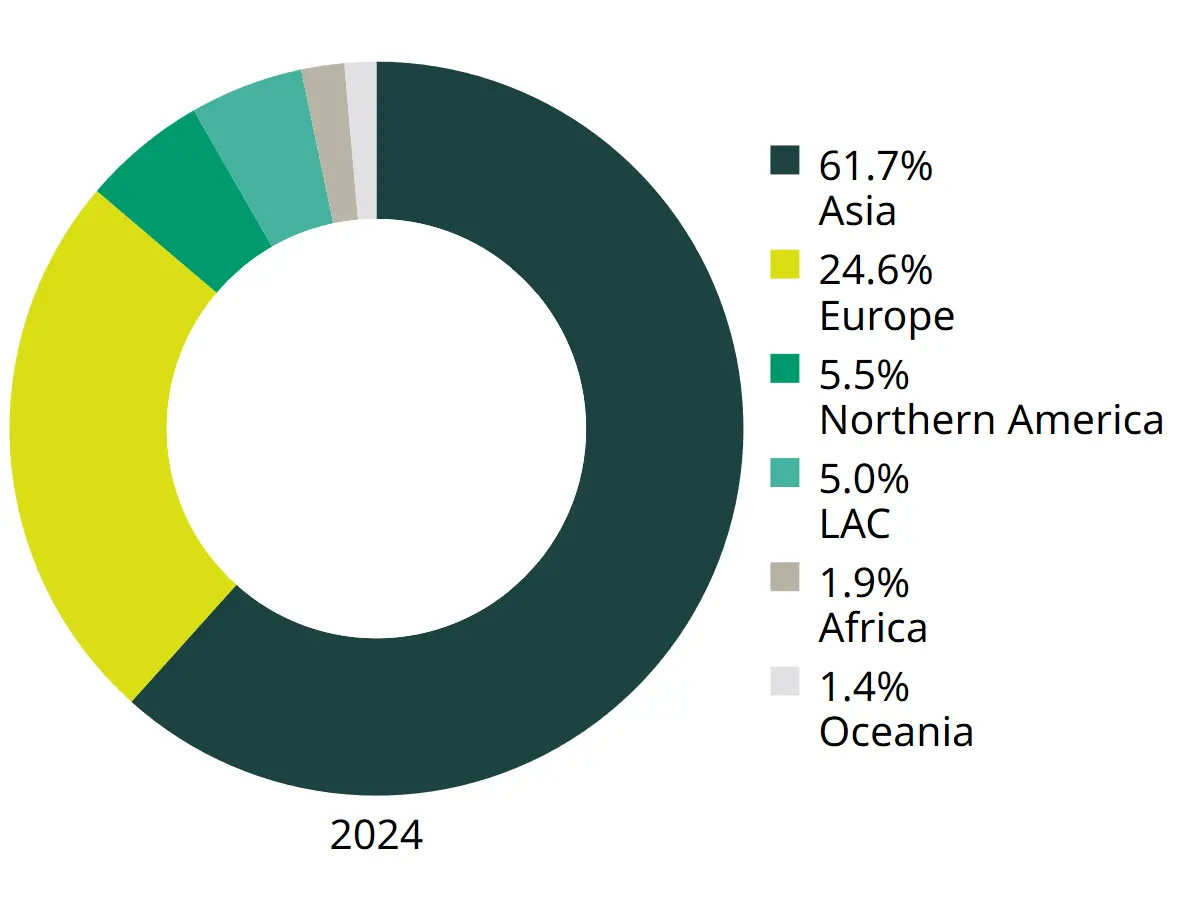
Plant variety applications by region, 2014 and 2024
Plant variety applications for the top 10 origins of the applicants, 2024
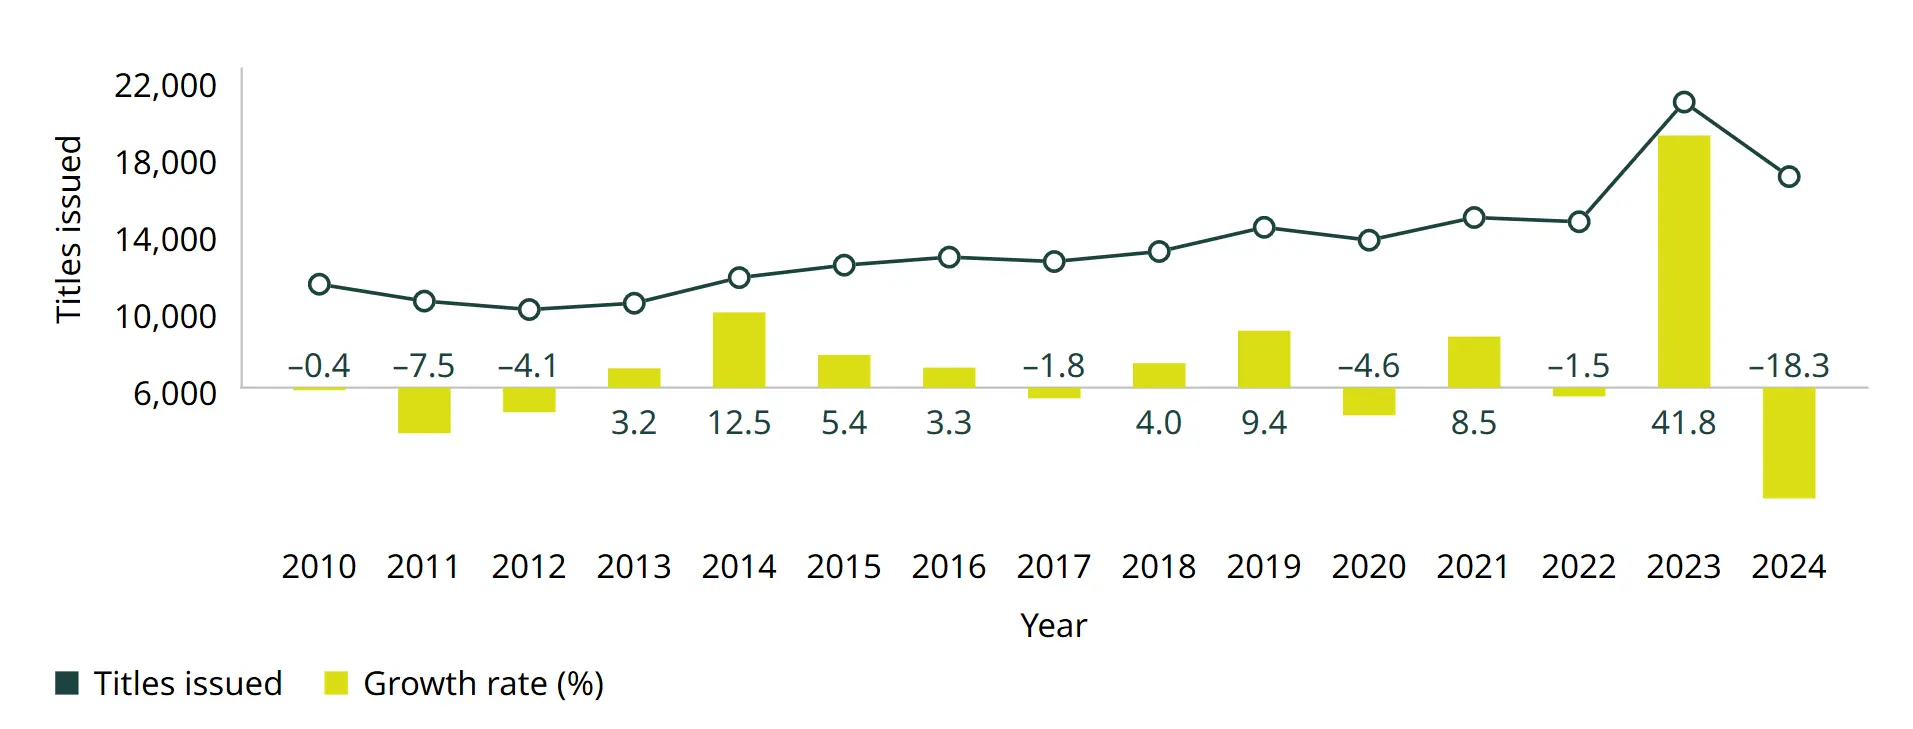
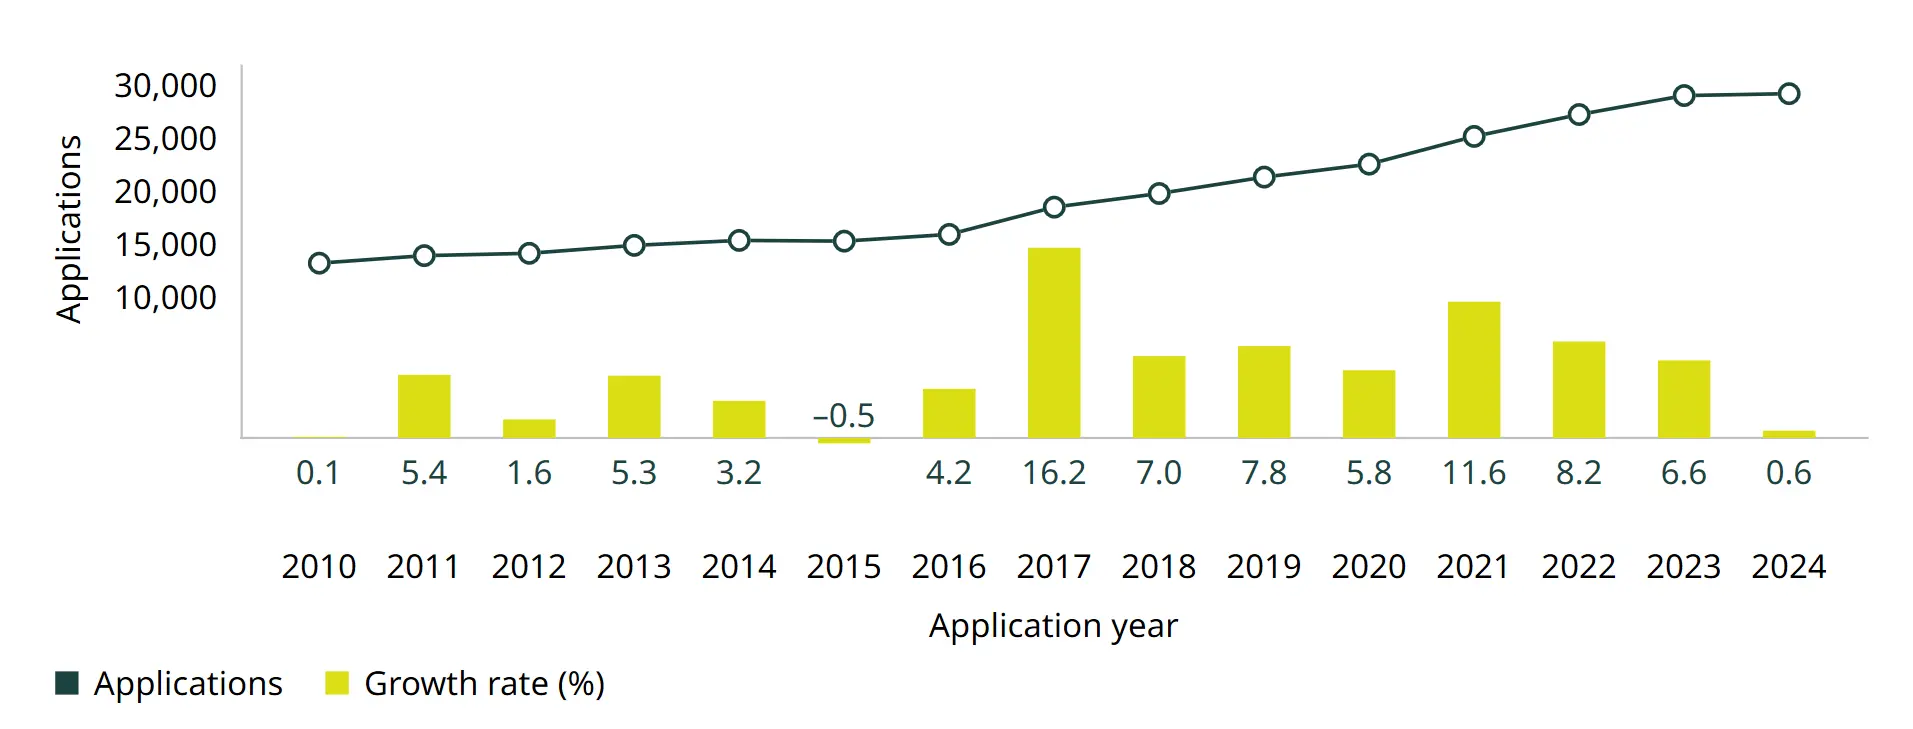
Trend in plant variety applications worldwide, 2010–2024
Trend in plant variety titles issued worldwide, 2010–2024